How to Read EXPLAIN ANALYZE in PostgreSQL
Ghazi · July 30, 2026
PostgreSQL's execution plan is a tree of operations. Plain EXPLAIN shows the planner's estimates. EXPLAIN ANALYZE runs the statement and adds actual row counts and timing, which lets you see where the estimates or work diverge from reality.
Start with EXPLAIN (ANALYZE, BUFFERS). Read from the deepest indented nodes upward. Compare estimated rows with actual rows multiplied by loops, then inspect the scan or join that consumes the most time or buffers.
A useful starting command
explain (analyze, buffers)
select id, created_at, total
from orders
where account_id = 42
order by created_at desc
limit 50;
ANALYZE executes the statement. Start with a read-only SELECT on production.
Read the plan as a tree
The most indented node runs first. Its rows feed the parent above it. Follow that flow upward instead of reading the output as a flat list.
The top node reports the total result, but the cause of a slow plan is often a deeper scan, sort, or join repeated many times.
Compare estimated and actual rows
Each node shows an estimated rows value and an actual rows value. When loops is greater than one, actual rows is the average per loop, so consider actual rows multiplied by loops.
A large mismatch can cause PostgreSQL to choose the wrong join type or scan. Refreshing statistics may help, but skew, correlated columns, and expressions can require a different index, query, or statistics definition.
Refresh statistics for one table
analyze orders;Do this because the statistics are stale, not as a ritual after every slow query.
Treat scan names as descriptions, not verdicts
A sequential scan is reasonable when the table is small or the query needs much of it. An index scan is useful when it can avoid reading most rows. A bitmap scan combines index matches before visiting heap pages.
If the plan points to an indexing problem, choose the index method from the operator and data shape rather than adding another default B-tree. The PostgreSQL index types guide compares B-tree, GIN, GiST, BRIN, and hash indexes.
- Seq Scan: reads table pages in sequence.
- Index Scan: follows an index and fetches matching table rows.
- Index Only Scan: can answer from the index when visibility information allows it.
- Bitmap Heap Scan: batches heap-page visits from one or more bitmap index scans.
Use buffers to separate CPU from reads
Shared hit means PostgreSQL found pages in shared buffers. Shared read means pages had to be read into the buffer cache. These are block counts, not distinct business rows.
A node with modest execution time on a warm cache but many reads can behave differently after a restart or under memory pressure. Compare representative runs and avoid tuning from one lucky cache state.
Check joins, sorts, and repeated work
Nested loops are efficient when the outer side is small and the inner lookup is cheap. They become expensive when a badly estimated outer result repeats an inner scan thousands of times.
A sort that spills to disk or a hash node that batches can indicate that the operation exceeded available working memory. Do not raise work_mem globally from one plan; it applies per operation and can multiply across concurrent queries.
Be careful with writes
EXPLAIN ANALYZE executes INSERT, UPDATE, DELETE, and MERGE statements. Use plain EXPLAIN first. If you need actual measurements in a controlled environment, wrap the write in a transaction and roll it back.
Measure a write without keeping it
begin;

explain (analyze, buffers)
update orders
set status = 'archived'
where created_at < date '2025-01-01';

rollback;
Triggers and other external side effects may not be reversible. Use a staging copy when that risk exists.
Keep the diagnosis close to the query
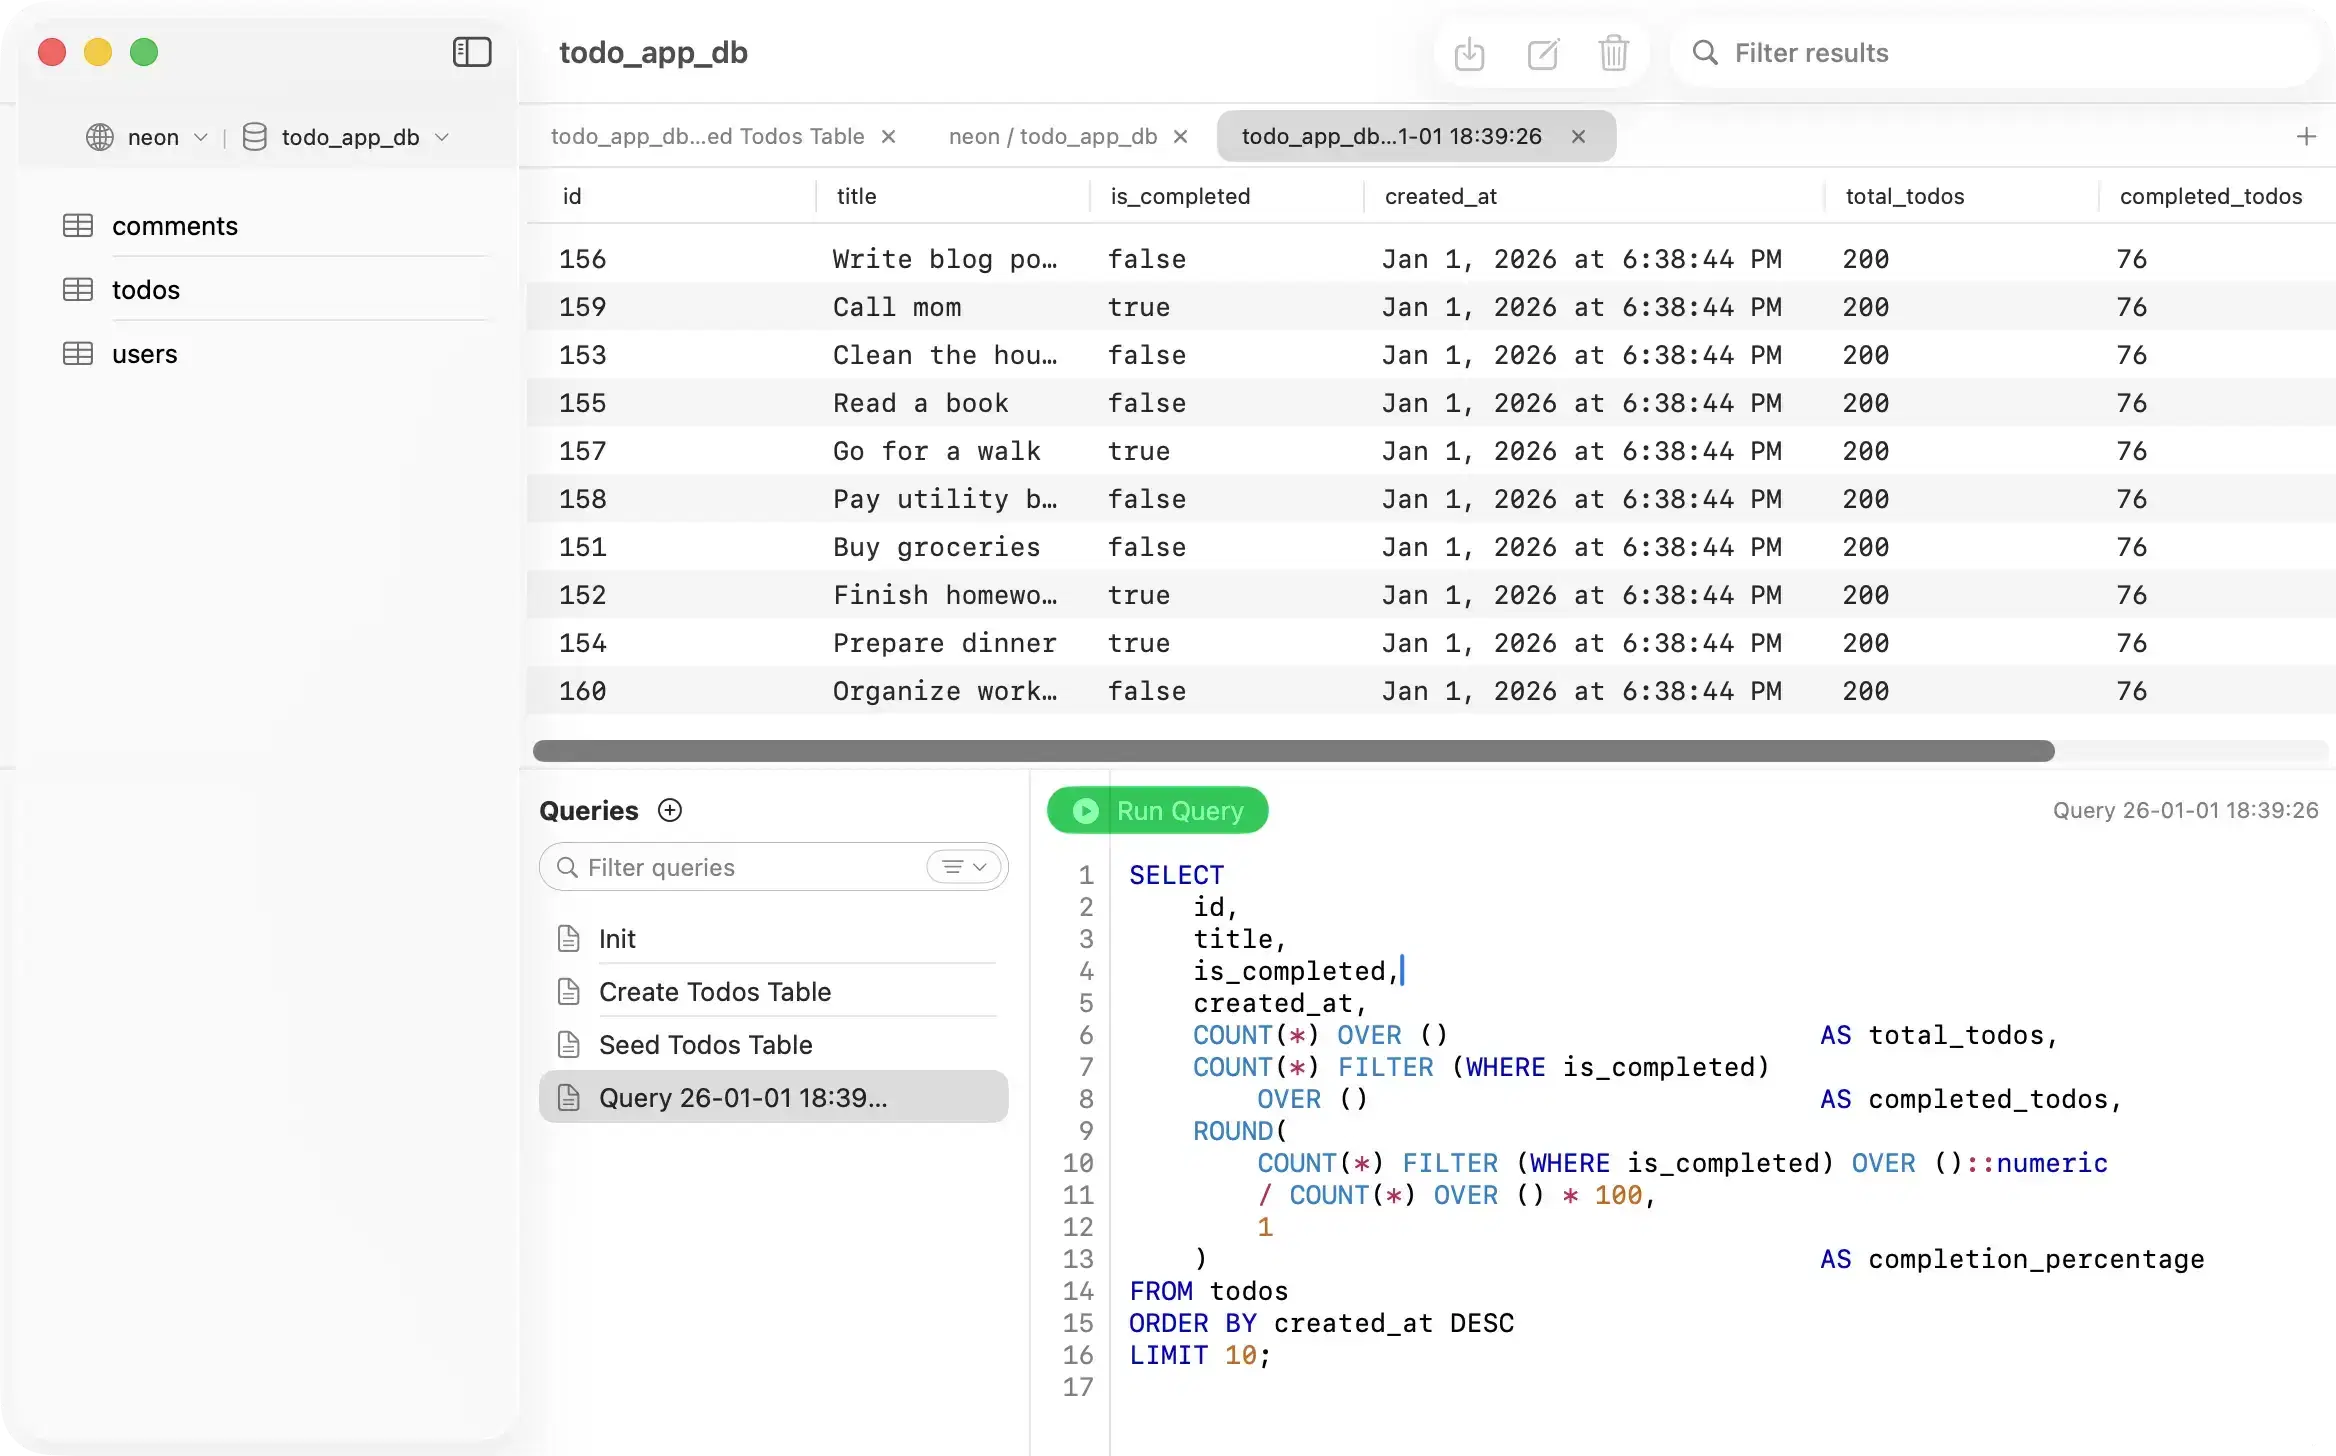
Save the original SQL, plan, row counts, and the change that improved it. PostgresGUI provides a native query workspace for this loop; see the PostgreSQL GUI for Mac page or compare it with the terminal in the psql versus GUI guide.
The goal is not to eliminate every sequential scan or lower every cost number. The goal is to reduce measured work for a representative query without making writes, memory use, or another important query worse.